We've created a dashboard for Schools
In this blog post we discuss the dashboard that our brilliant developer Alec created to engage young learners in understanding more about the rainfall in their local area
- #Dashboard
- #SUDS
- #Schools
Engaging Younger Generations in Rainfall and the Story Behind the Rainwater Dashboard
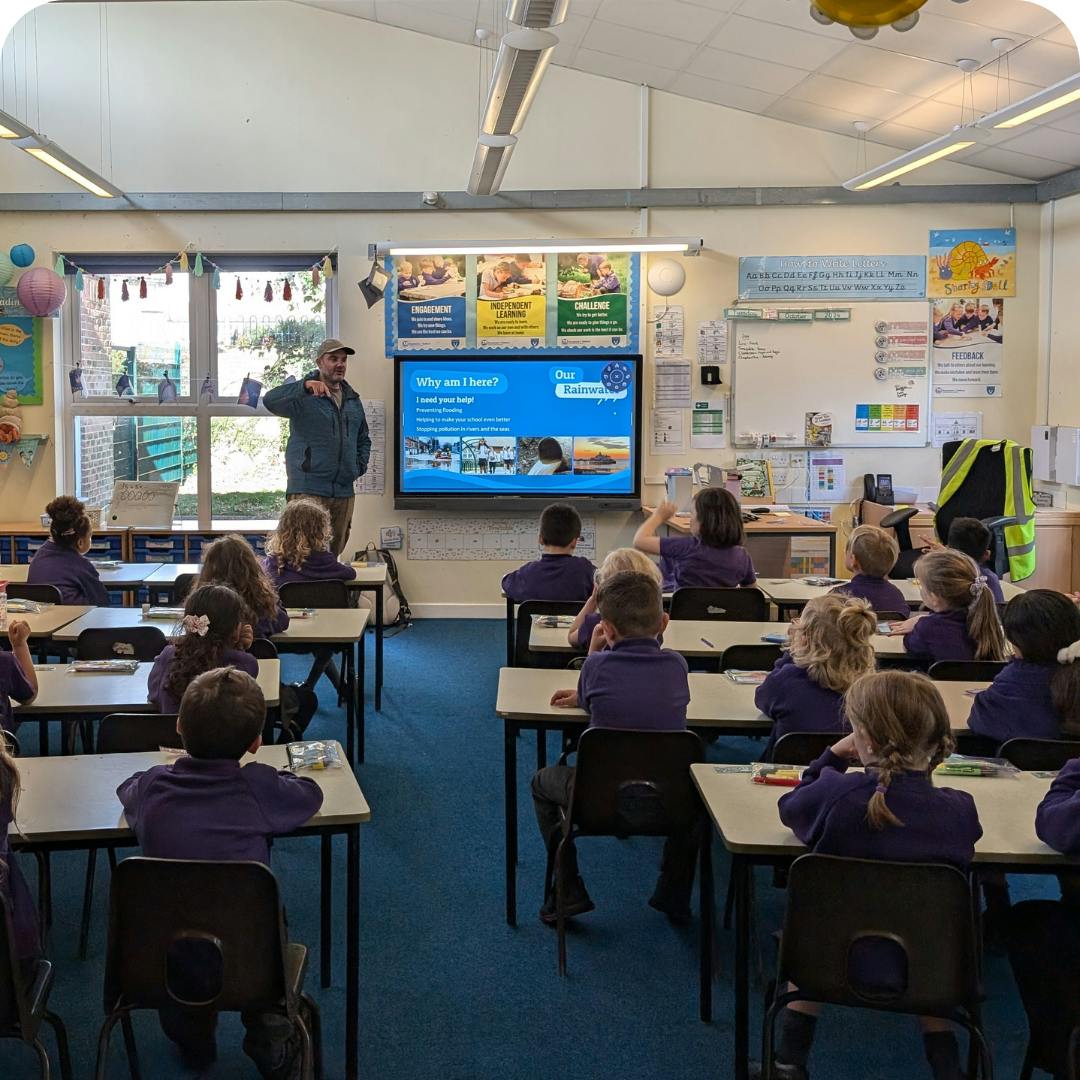
After a series of successful engagement initiatives with schools over the past couple of years, we were thrilled to support teachers and their students with a fresh, innovative approach to learning about rainwater.
The Rainwater Dashboard by Our Rainwater was developed with a clear purpose: to make real-world environmental data meaningful, accessible and engaging for young learners. From the beginning, our focus was on creating a tool that could bring rainfall data into the classroom in a way that inspires curiosity and builds understanding about water as a precious resource.
We caught up with our Junior Developer, Alec, who brought the vision of the rainwater dashboard to life as a powerful resource for schools to use.
About Alec
Alec joined the team over the summer and jumped straight into his role, tackling various ongoing projects. Transitioning from a teaching role focused on ecology, Alec was excited to apply his expertise in both education and environmental science to this project, combining technical skill with a passion for student learning - making him the perfect choice to adapt our dashboard for learners!

Getting Stuck into the Design
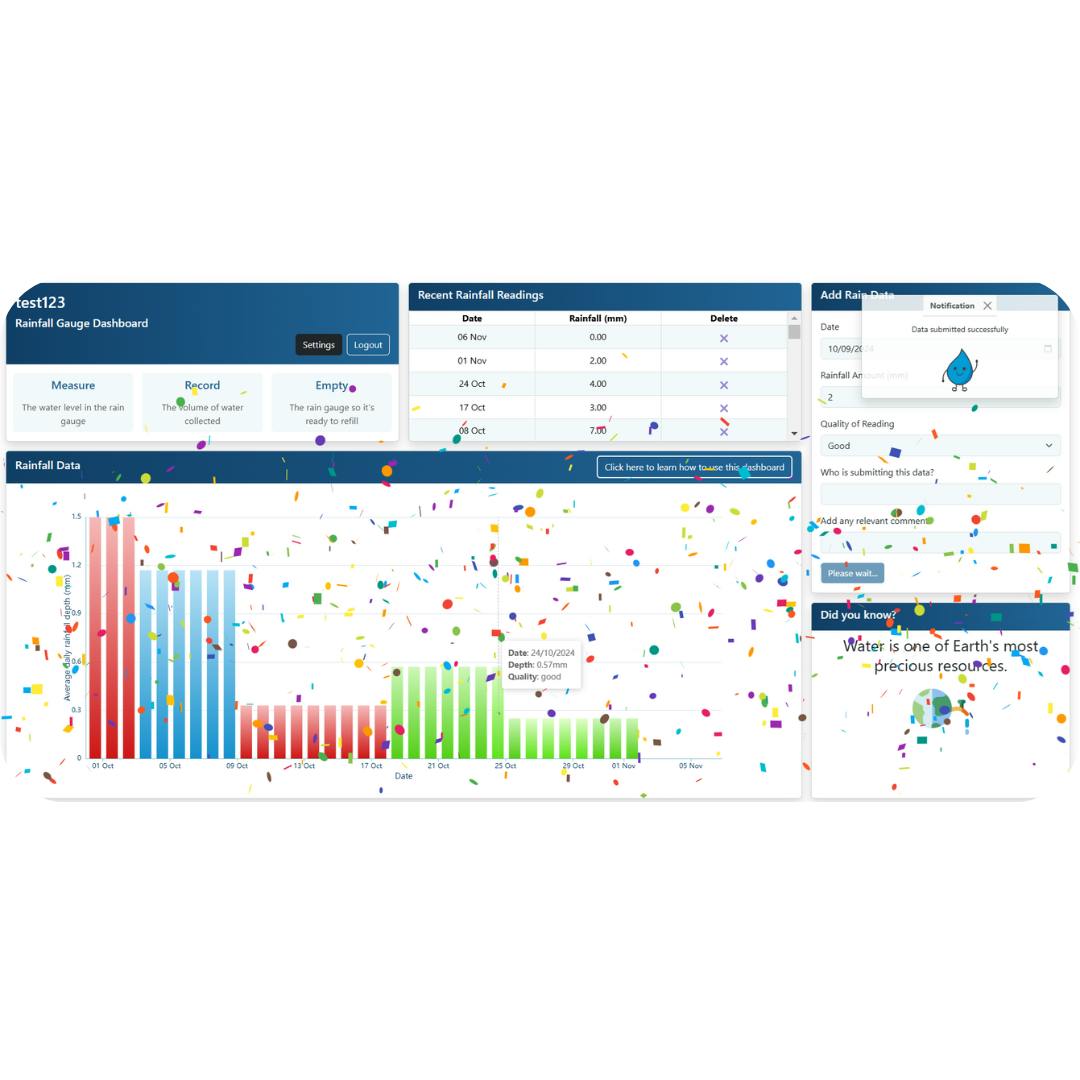
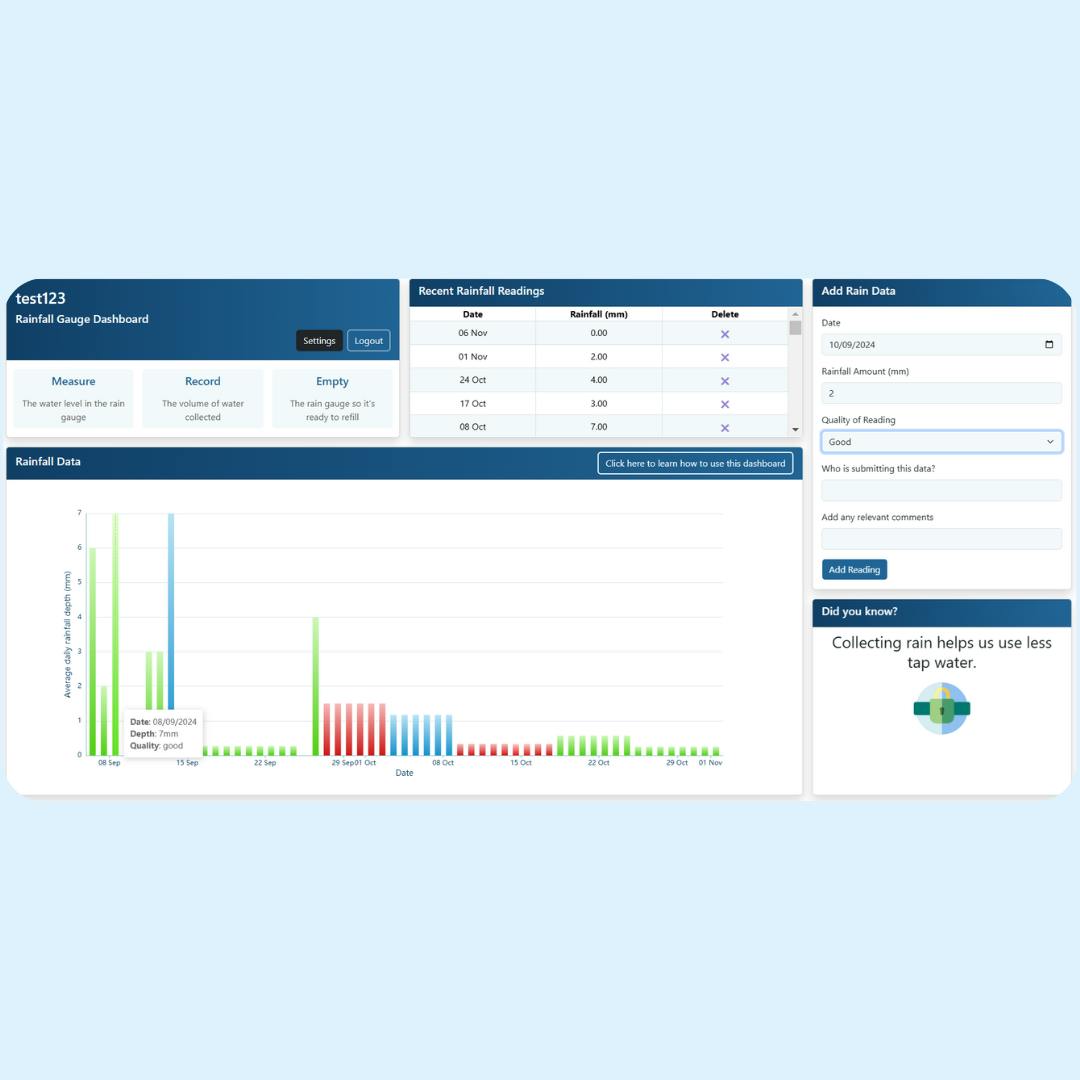
Alec designed the dashboard with students in mind, aiming to make data analysis exciting and accessible. The dashboard turns rain data into an interactive chart and a table, giving students hands-on experience with real-world data.
Excited by the project, Alec wanted to ensure the dashboard retained engagement, helped students learn and inspired them to connect with rainwater, understanding it as a finite resource. The dashboard enables students to visualise and better understand the data they collect about rain, making it a powerful resource and teaching tool!
From confetti animations on data submissions to visual responses that celebrate students’ contributions, every feature was designed to keep learners engaged and curious. Alec explained "as a junior designer it was really nice to have autonomy on a project and get stuck in". With a commitment to accessibility, Alec ensured that the dashboard design includes features like keyboard navigation, high contrast colours, and ample white space, making it usable for all students and teachers.
What Features were Included?
Submission Form & Visual Responses
The data submission form, with its visually responsive feedback, encourages students to take ownership by identifying themselves in each data upload, celebrating their contributions with animated visuals upon submission.
Charts, Graphs & Tables
Interactive graphs and tables bring rain data to life, updating in real-time as students upload their findings. These visual aids help students grasp concepts like rainfall patterns, making data analysis an engaging experience.
The Our Rainwater Mascot
The Our Rainwater mascot has been featured throughout the dashboard, serving as a student guide. Acting as a friendly face and animated to aid with engagement, the mascot also appears when a rainfall reading has been successfully submitted.
Inspiring the Future Generation
This learning tool is now being used in schools throughout the country. Inspiring the next generation to help tackle climate change, take care of our water resources and become more climate resilient is entwined with our mission. We remain committed to innovation, and to supporting educators and students with tools that turn data into discovery. If you are a school or teacher and are interested in using our dashboard, please do not hesitate to get in touch.